
Digital Field Mapping: How to Plan Every Season with Precision
Every farming season starts with the same question: what goes where? For generations, the answer lived in a farmer’s memory, on paper maps pinned to the office wall and in notebooks full of field names, areas and dates. That knowledge is valuable, but it is also fragile. It is hard to share with your team, easy to lose and almost impossible to analyse when you need to make a decision quickly.
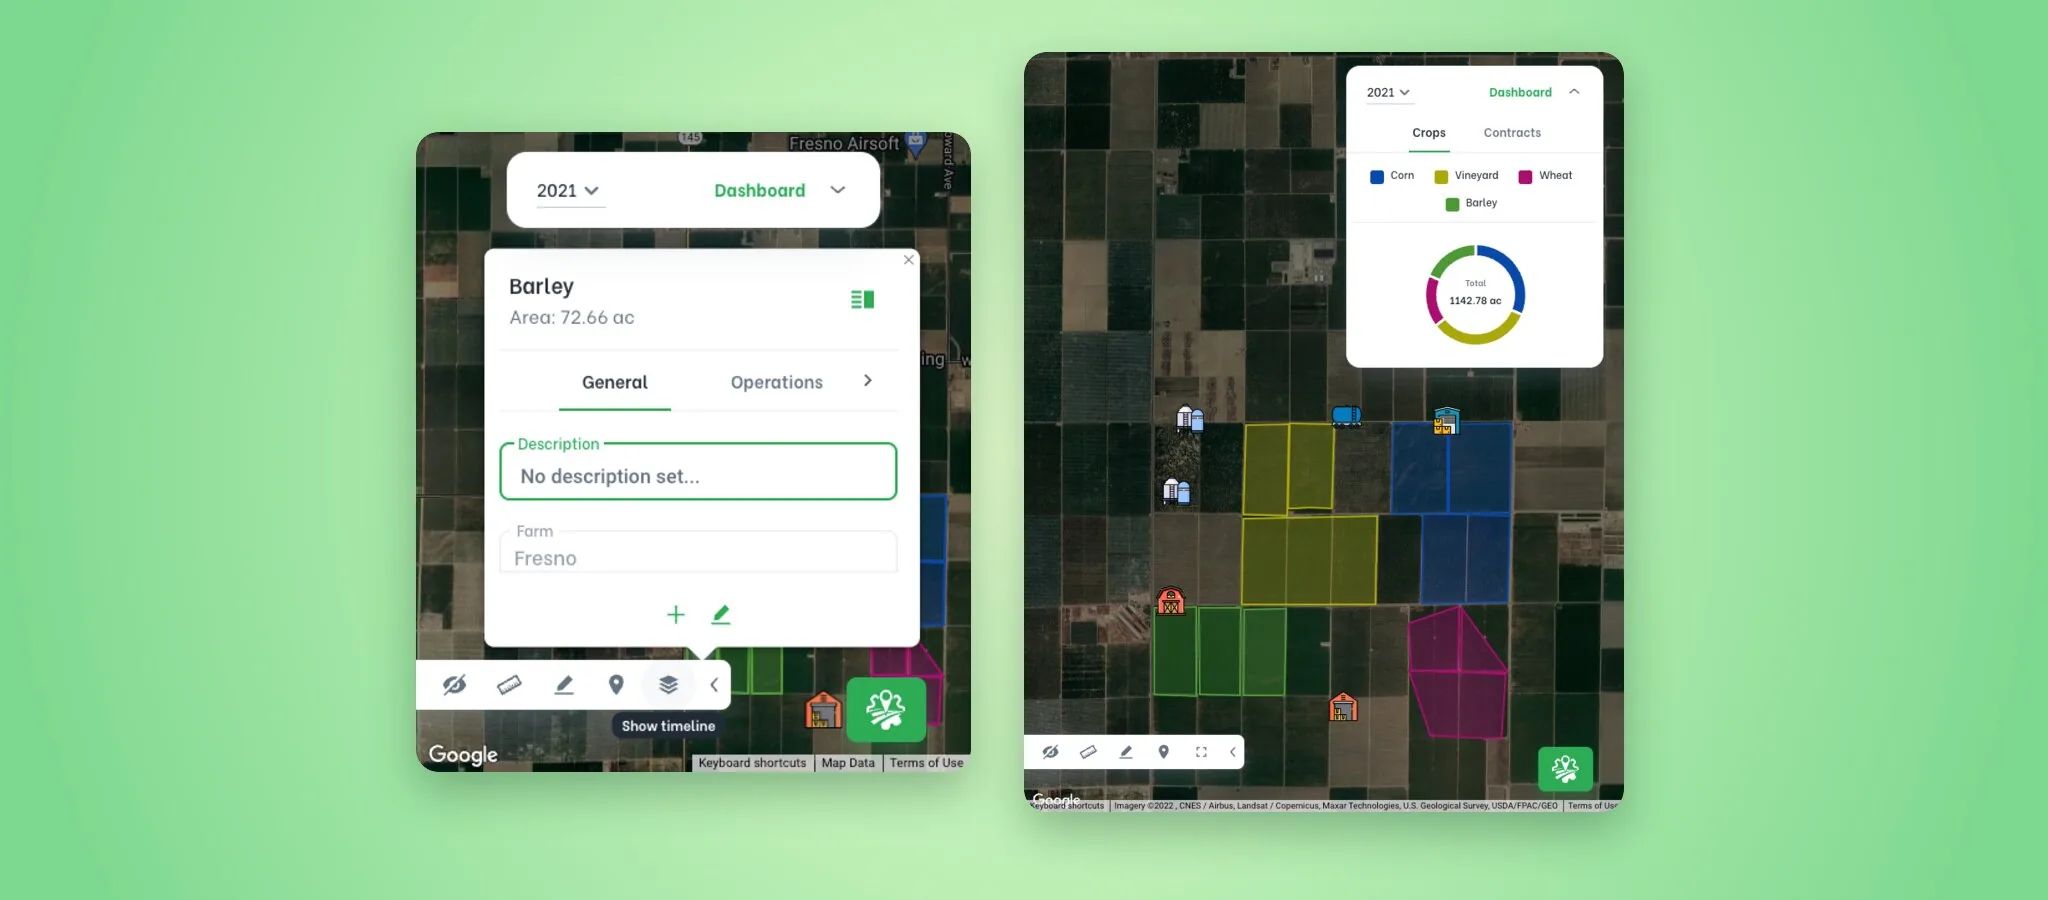
Digital field mapping changes that. By drawing your fields on a satellite map and linking every piece of information to the right parcel, you get a single, always up-to-date picture of your farm. In this article we explain what digital field mapping is, why it matters and how to start using it on your farm.
What is digital field mapping?
Digital field mapping means recording the exact boundaries of each field or parcel on a georeferenced map, usually on top of satellite imagery. Each shape becomes more than a drawing: it holds the field’s area, the crop planted in each season, the work done there, the inputs applied and the contracts that cover it.
Instead of searching through folders and spreadsheets, you click on a field and see its whole story. That is why mapping is often the first step in any modern precision farming strategy.
Why paper maps and spreadsheets fall short
Paper maps and spreadsheets worked for decades, but they struggle with the way farms operate today:
- Information is scattered. Areas sit in one file, operations in another and contracts in a drawer, so getting a complete picture takes time.
- Data goes out of date. When a field is split, merged or rented, someone has to remember to update every document.
- Sharing is difficult. Team members, agronomists and accountants often work from different versions of the same information.
- History gets lost. Comparing this season with previous ones is slow when records live in different formats and places.
5 ways digital field mapping helps you plan every season
1. Accurate field boundaries and areas
When fields are drawn on a satellite map, areas are calculated automatically from the shapes. You know exactly how many hectares or acres you are planning for, which makes it easier to estimate seed, fertilizer and fuel needs, and to compare the area you farm with the area you declare.
2. A clear crop rotation history
Good rotation planning depends on knowing what grew in each field in previous years. With a digital map you can switch between seasons and see, field by field, which crops were planted. This makes it easier to protect soil health, break pest and disease cycles and plan the next season with confidence.
3. Field operations linked to the right parcel
Ploughing, sowing, spraying, fertilizing, harvesting: every operation can be recorded directly on the field where it happened. Later you can see precisely what was done, when and by whom, which helps with planning, traceability and any audit or subsidy paperwork.
4. Contracts and land use in one place
Many farms work land under different lease or ownership agreements. Linking each contract to the parcels it covers on the map shows at a glance which fields are rented, when contracts expire and how your land base is changing over time.
5. Better planning of inputs and stocks
When you know the exact area and crop of every field, planning inputs becomes much simpler. Combined with stock tracking, you can see what you have on hand, what each field will need and what has already been used, so you buy the right quantities at the right time.
How to get started
- Draw or import your fields. Start with your existing boundaries. If you already have field shapes from another system or from your local agricultural authority, import them instead of drawing everything again.
- Assign crops for the current season. Add the crop for each field so your map reflects what is actually growing.
- Record operations as they happen. Make it a habit for your team to log work directly on the field, ideally on the same day.
- Connect contracts and stocks. Link lease agreements and inputs to the fields they belong to.
- Review the history before planning. At the end of the season, use the map to compare yields, costs and rotations before deciding what to plant next.
How AgriSo helps
AgriSo was built around an interactive farm map. You can import your field shapes in the most common formats, see every parcel on satellite imagery and switch between seasons to review crop history. Operations, contracts and stocks are all connected to the fields they belong to, so the whole team works from the same up-to-date information, from the office or from the field.
Want to see your own farm on the map? Start your 14-day free trial – no credit card required – or explore our plans.
Related Posts

Bring efficiency to your farmwork
From planting to harvesting, AgriSo has you covered!